The end of spreadsheet chaos

See how we turn messy data into board-ready clarity.

Your QuickBooks and Stripe data don't talk to each other. We fix that. This is an example of the Cash Runway & Liquidity view we generate after cleaning your data stack using Python and SQL.

Want to see how it’s built? Explore our Tech Stack or the Finance Transformation framework.
⚡ Near real-time refresh
Built to eliminate spreadsheet fatigue and stale reporting cycles.
🔐 Governed logic layer
Consistent definitions across reporting, forecasting, and drilldowns.
🌍 Multi-entity ready
Great for teams running India + US (or multiple entities & gateways).
Interactive Cash Runway and Liquidity Dashboard built by VextaCFO
🔒
Live demo locked
Enter your details to unlock the interactive experience at /cash-runway/.

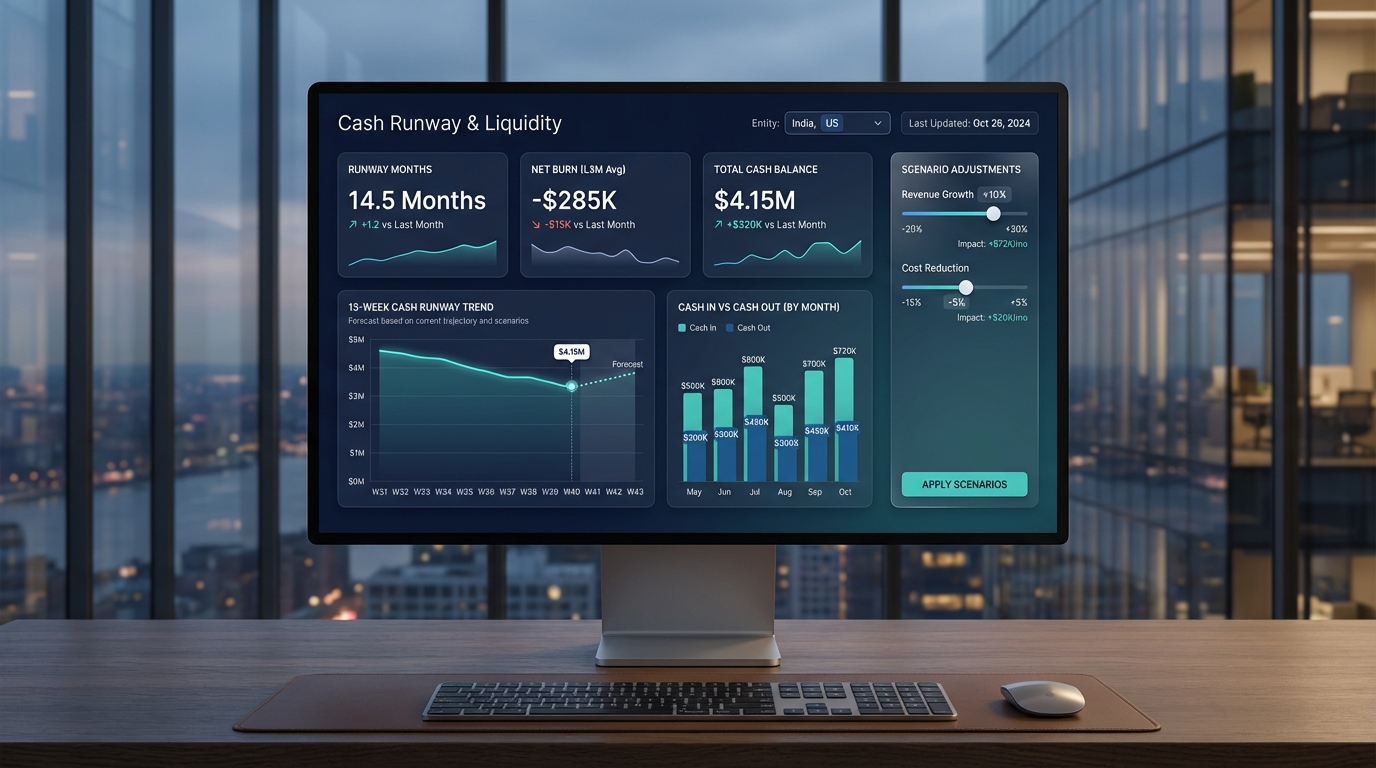
The Problem: You can't trust your current cash numbers.

A typical Series A client had data trapped in Stripe, three different bank accounts, and QuickBooks. Their founder was spending 5 hours a week trying to figure out their true burn rate, and it was still wrong.

🚫

Before: The Chaos

"Why doesn't Stripe match QBO?" Manual CSV downloads, broken formulas, and zero confidence when investors ask about runway.

After: The Wedge

We used Python to reconcile the data layer. Now, a single, governed Power BI view refreshes automatically every morning.

After

Automated ingestion + logic layer + governed dashboards. One consistent “single source of truth” that refreshes frequently.
📈

Impact

Faster decisions, cleaner investor reporting, and “what-if” visibility for burn, runway, and cost drivers.

What you’ll experience in the interactive demo

This page sets expectations: the demo shows dashboard style, interactivity, and how we model financial logic. When you unlock, you’ll land on the live demo at https://www.vextacfo.com/dashboard/.

Tip: keep screenshots at 1600×900+ for crisp results. Blur sensitive client fields if needed.
Dashboard screenshot preview

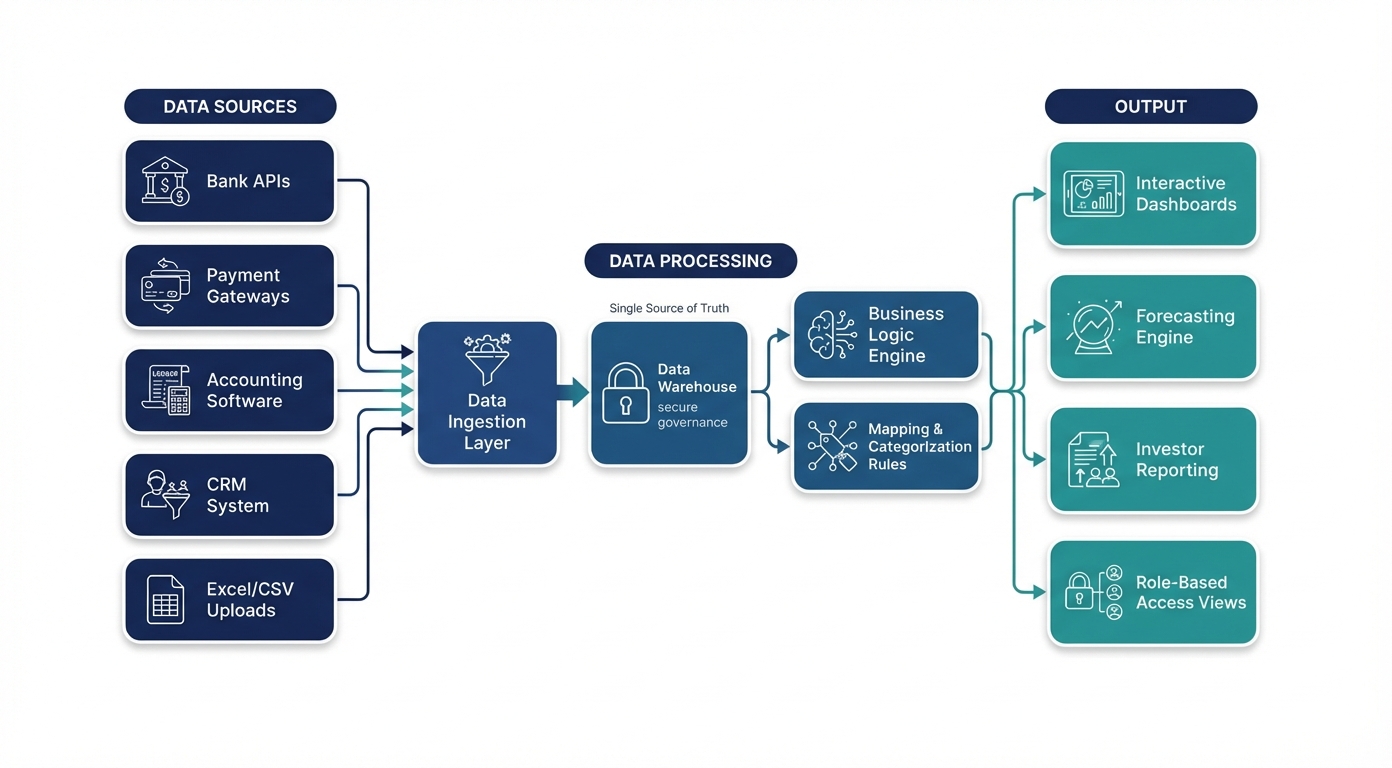
How we build dashboards founders can trust

The difference isn’t “charts.” It’s the engineering behind the numbers: ingestion + mapping + logic + governed access. That’s what makes dashboards usable for investor reporting, weekly reviews, and decision-making.

1️⃣

Ingest & normalize

Connect to banks, gateways, ERPs, CRMs, spreadsheets, or custom databases — then standardize entities and fields.
2️⃣

Map to your logic

COA mapping, categorization rules, cash timing logic, and definitions aligned to your leadership team.
3️⃣

Visualize & govern

Role-based access, read-only dashboards, consistent definitions, and repeatable reporting that doesn’t break.
VextaCFO data pipeline: ingestion → normalization → logic layer → dashboards

More dashboards we build (same approach, different use-cases)

Cash runway is one case study. The same system design powers a full finance ops engine — automated reporting, forecasting, budgeting, revenue ops, CRM analytics, marketing analytics, and more.

📊
Automated reporting Investor packs, MIS, department dashboards — consistent definitions, fewer manual steps.
🔄
13-week cash flow Direct-method forecasting with controllable assumptions and working capital drivers.
🎯
Budget vs actuals Variance analysis + accountability — matched to how founders run reviews.
🤝
CRM & revenue ops Pipeline health, cohorts, LTV:CAC, collections and revenue quality signals.
📣
Marketing analytics Channel ROI, CAC by cohort, attribution sanity checks, unit economics alignment.
🧾
Collections & AR Ageing, recovery plan, credit policy insights — tied to cash forecasting.
🏷️
COGS & margin bridge Driver-based margin movement: price, mix, discounts, shipping, returns.
🧠
Forecasting engine Scenario planning models that connect assumptions to outcomes across the business.

Frequently asked questions

Common questions we get when founders evaluate dashboarding + automation projects.

How long does it take to build a dashboard like this? +
A focused dashboard typically takes 2–4 weeks once data sources and mapping are confirmed. Larger engagements often run 4–8+ weeks depending on complexity and data readiness.
Can you work with our current tools (QBO/Xero/Stripe/banks/CRM)? +
Yes. We’re tool-agnostic and build connectors and a logic layer on top of your current stack — no rip-and-replace required.
Is our financial data secure? +
Security is core. Dashboards are typically read-only with controlled access. You control who sees what, and data access follows secure patterns.
What if our business logic changes later? +
That’s why we build a central logic layer. Update a rule once and all connected dashboards reflect the change.
What should we prepare before starting? +
Your key data sources, your internal reporting definitions (what “cash” means), and the top 5 decisions you want the dashboard to improve.

Want dashboards like this for your business?

Unlock the demo to experience the interactivity, or book a call to discuss reporting, forecasting, 13-week cash flow, budgeting, CRM, and marketing analytics.