Automated Finance Intelligence System for a High-Growth E-Commerce Business
From spreadsheet chaos to board-ready visibility in 15 days using a Build-Operate-Transfer (BOT) model.
1Executive Snapshot
The client, a high-growth D2C brand, was struggling with fragmented finance data across ERPs, payment gateways, and marketing platforms. Manual reconciliation was causing delays and errors, leading to decisions based on outdated numbers. We implemented an automated finance intelligence system to establish a single source of truth.
Results achieved while maintaining controls
- Daily decision visibility: Across revenue, refunds, marketing efficiency, and inventory health.
- Cleaner reconciliations: Faster month-end close with traceable data lineage.
- Reduced spreadsheet risk: Fewer internal "number disputes" and manual reporting errors.
- Audit-ready reporting pack: Consistent metrics, evidence trails, and role-based access.
- Smooth BOT transition: Internal team trained and monitoring playbook activated.
2Business Context & The Real Problem
The founder was facing significant challenges due to fragmented data. Critical decisions regarding runway, margin, and ROAS were being made based on inconsistent or outdated numbers. Manual processes for reconciling orders, payments, and refunds were creating delays and errors, and there was limited visibility into profitability drivers by channel, product, or geography.
What the founder could see (Before)
- Fragmented finance data across various tools.
- Conflicting metrics across different teams.
- Delayed month-end numbers due to manual reconciliation.
What the founder could not see (Before)
- Real-time profitability by channel and product.
- Clear visibility into refund leakage and its impact.
- Daily, trusted numbers for confident decision-making.
Why it happened (root cause)
- Data scattered across ERP, payment gateways, and marketing platforms.
- Reliance on manual spreadsheets and copy-paste for reporting.
- Lack of a single source of truth for finance data.
What leadership needed weekly
- One trusted set of numbers, accessible daily.
- Automated reconciliation to speed up the close process.
- Audit-ready documentation and controls.
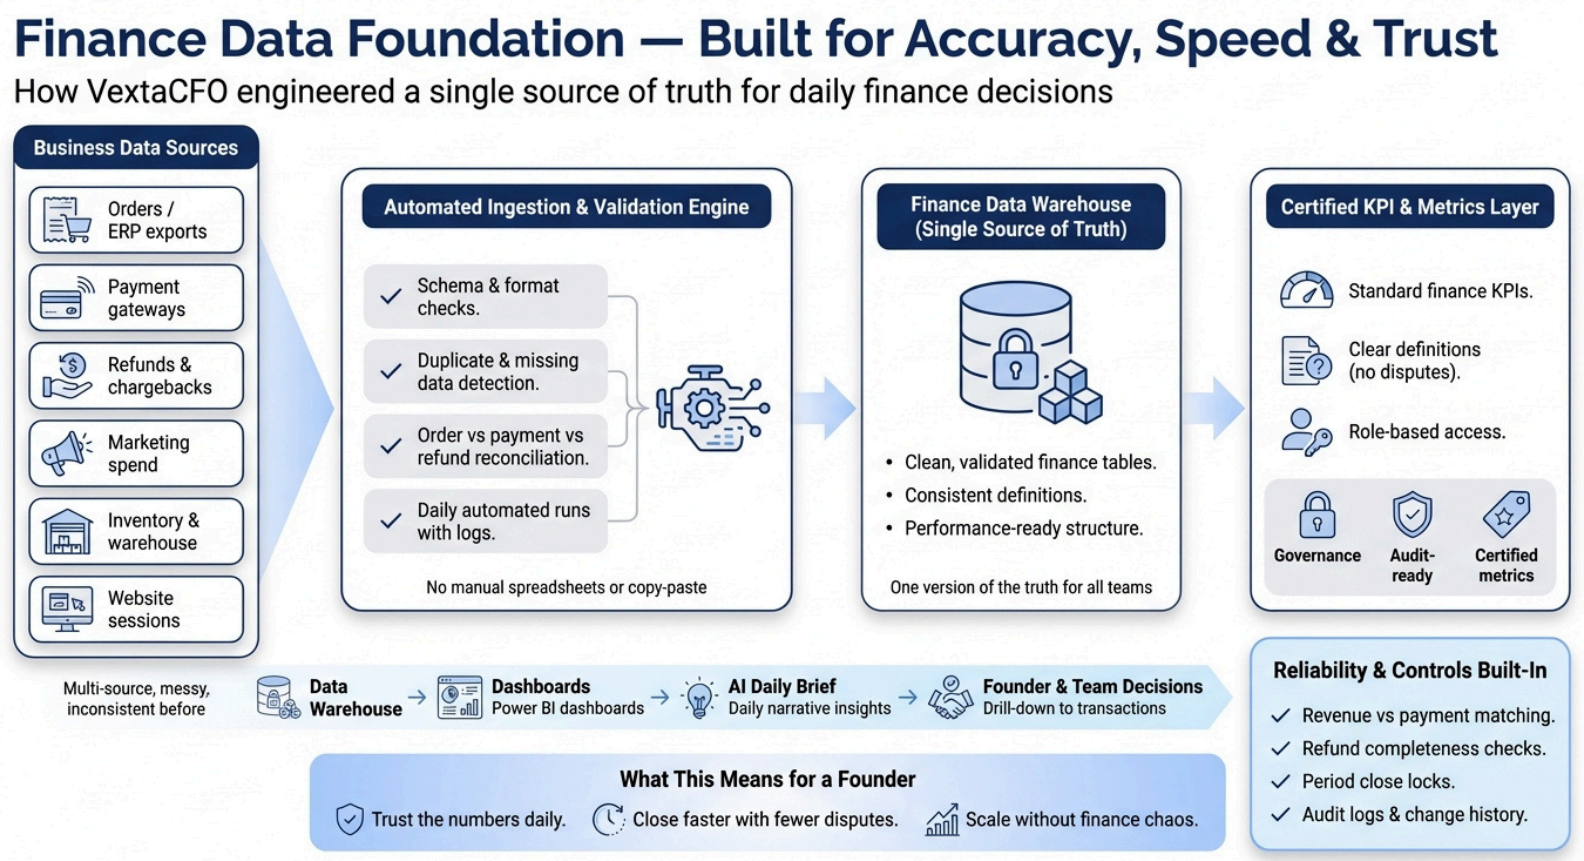
3Solution Architecture & Data Foundation
We engineered a single source of truth by building an automated ingestion and validation engine. This engine pulls data from various sources, performs quality checks, and loads it into a structured finance data warehouse.
Data Sources
Ingesting data from multiple, multi-format sources.
- Order Management / ERP exports (CSV)
- Payment gateways (settlements)
- Refunds & returns logs
- Marketing spend (channel-level)
- Inventory snapshots & Website sessions
Ingestion & Validation Layer
Automated pipelines with built-in quality gates.
- Schema checks & Type enforcement
- Duplicate detection & Missing value rules
- Reconciliation checks (orders vs payments vs refunds)
Storage: MySQL Warehouse
The Single Source of Truth for finance data.
- Raw fact tables + dimensions
- Indexing for BI performance
- Controlled access credentials
Semantic Model: Power BI
A certified dataset for standardized reporting.
- Clean relationships + star schema
- Standardized Finance metrics (DAX measures)
- Role-based security (RLS)
Data Model Design Principle
- Star Schema: Fact tables linked to dimension tables for efficient querying.
- Grain Definition: Defined per table to avoid metric distortion.
- Single Direction Filtering: Dimensions filter facts to ensure accurate reporting.
4Controls & Quality Assurance
Reliability was built in from the start. We implemented reconciliation controls and data governance policies to ensure accuracy and security, reducing spreadsheet risk and satisfying audit expectations.
Finance Reconciliation Controls
- Revenue vs payments matching (by day / gateway)
- Refund completeness checks (status + amount)
- Tax/discount consistency checks
- Duplicate order/payment detection
- Period close lock + change log
Data Governance & Security
- Role-based access (Founder vs Finance vs Ops)
- Least-privilege DB credentials & secrets handling
- Audit trail: refresh logs + dataset certification
- Documentation: data dictionary + KPI definitions
- Confidentiality: anonymized extracts for sharing
5Decision Layer: Dashboards, KPIs & AI Executive Brief
Stakeholders now consume trusted metrics daily through role-based Power BI dashboards. A standardized KPI framework ensures the entire leadership team aligns on definitions.
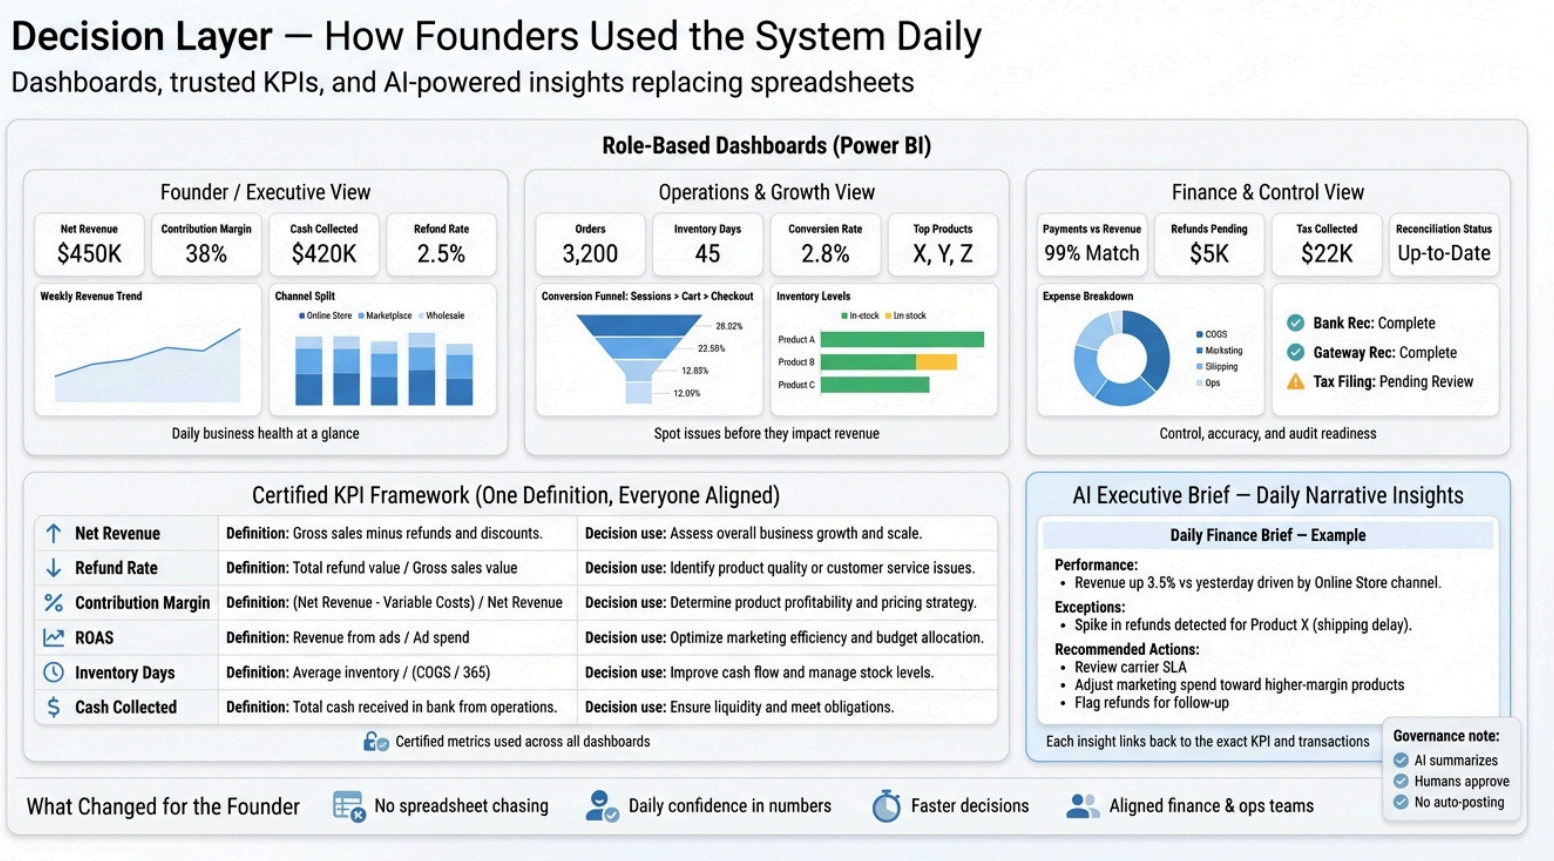
KPI Framework (Standardized, Auditable)
| KPI | Definition (1 line) | Decision Use (1 line) |
|---|---|---|
| Gross Sales | Total order value before refunds/discounts | Top line growth monitoring |
| Net Revenue | Sales minus refunds and discounts | True revenue visibility and reporting |
| Refund Rate % | Refunds divided by gross sales | Leakage monitoring and quality control |
| AOV | Net revenue divided by total orders | Pricing strategy and basket size optimization |
| ROAS | Revenue divided by marketing spend | Channel efficiency and campaign performance |
| Contribution Margin | Net revenue minus variable costs | Profitability control and pricing decisions |
| Inventory Days | Avg stock / avg daily sales | Replenishment planning and working capital |
| Cash Collected | Payments received net of fees | Liquidity monitoring and cash flow management |
AI Executive Brief (Daily Narrative Insights)
An AI-powered daily brief summarizes performance, flags exceptions (like refund spikes), and recommends actions — with traceability to certified KPIs.
- Daily Brief: Performance summaries and exceptions.
- Recommended Actions: Next best steps based on data.
- Traceability: Links back to underlying transactions.
- AI Governance: AI summarizes, humans approve.
6Delivery Governance, Controls & BOT Handover
We used a Build-Operate-Transfer (BOT) model so the system becomes sustainable after handover — not dependent on external support.
Build-Operate-Transfer (BOT) Model
Build (Days 3–9)
System design & implementation. KPIs and controls defined. Documentation pack created.
Operate (Days 10–15)
Daily runs monitored. Exceptions triaged. KPI adoption sessions for stakeholders.
Transfer (Handover)
Client team trained. Ownership handed over. Handover checklist signed off.
Controls, Audit Trail & Security
- Audit Trail: Refresh logs, ETL run logs, reconciliation evidence packs retained.
- Security: Role-based access, least privilege, credential controls.
- Designed for auditor review.
Post-Go-Live Outcomes
- Daily metrics used in weekly growth reviews.
- Faster close with fewer disputes.
- Finance and operations aligned on one set of numbers.
Key Challenges & How We Solved Them
- Inconsistent IDs/dates: Standardized keys + enforced types.
- Refund & payment mismatches: Reconciliation checks + exception workflow.
- Metric disputes: Certified KPI dictionary + single semantic model.
- Access concerns: Role-based access + least privilege.