From Spreadsheet Chaos to Predictive Runway: 13-Week Cash Flow for a Cross-Border D2C Brand
ABC (name changed), a Bengaluru-led D2C company with a US operating office, needed one integrated view of liquidity across India and the US—built to be investor-grade for future fundraising and daily decision-making.
1) The breaking point: a fast-growing D2C system that started “bursting”
Executive contextABC scaled quickly across India and the US. Revenue grew, marketing spend increased, inventory cycles expanded— but finance remained fragmented. A near-miss happened when a US campaign spike (Stripe/Mercury) coincided with India compliance + vendor payouts (Razorpay/HDFC). Cash looked “available” in one sheet, but reality was different.
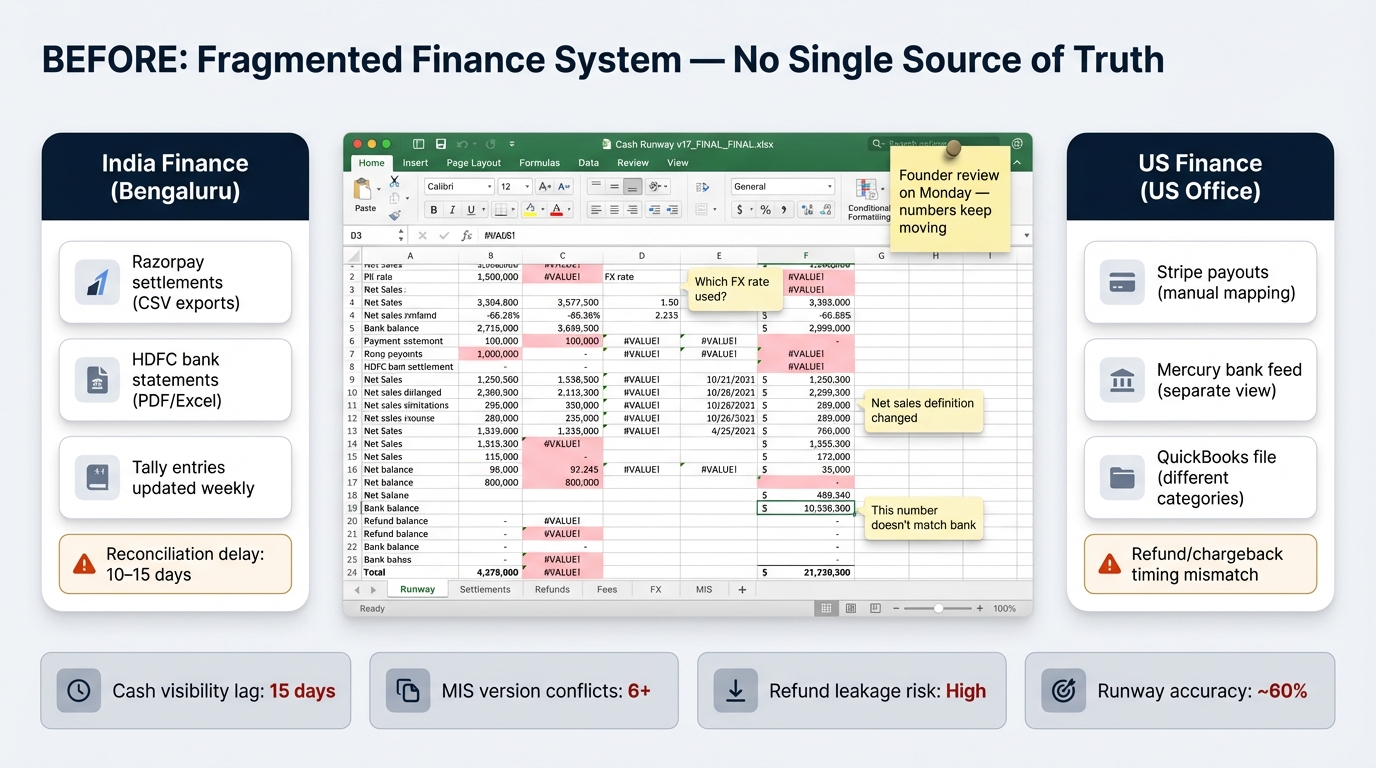
What their finance looked like (before)
- India: Razorpay settlements, HDFC statements, manual reconciliation; accounting entries posted after delays.
- US: Stripe payouts, Mercury bank activity tracked separately with different categories.
- MIS: Multiple versions, different date cutoffs, inconsistent “net sales” vs “gross sales” logic.
- Cash planning: A spreadsheet runway view updated weekly—often wrong after refunds/chargebacks.
Typical D2C failure modes we saw
- Refunds/chargebacks posted late → overstated cash + revenue.
- Gateway fees, shipping, COD, discounts not mapped consistently → margin confusion.
- Different time zones / settlement timelines → false “cash availability”.
- Intercompany inventory transfers not standardized → duplicate cost recognition.
Why they engaged VextaCFO
The founders needed investor-grade clarity ahead of future fundraising: one “source of truth” across India + US, a repeatable 13-week cash flow, and a system that could be owned by the internal team with clear SOPs.
2) Diagnosis: what exactly was breaking (and where the numbers leaked)
Root cause analysisWe ran a structured diagnostic across order-to-cash, record-to-report, and treasury. The issue wasn’t “accounting”— it was the absence of a robust finance architecture: data contracts, mapping rules, quality gates, and governance.
Data integrity gaps
- Duplicate transactions: Same order captured in OMS + gateway exports with different keys.
- Refund timing: Refund initiated vs refund settled vs refund debited—3 dates, 1 spreadsheet column.
- Settlement mismatch: Payout net of fees, but fees posted as separate line items inconsistently.
- Currency reality: USD→INR conversion done ad-hoc; forex impact never reconciled to bank.
Decision-making gaps
- Runway blindspots: No forward view of payroll, taxes, vendor due dates across entities.
- Marketing burn: CAC visible, but cash impact (timing + net payouts) not visible.
- Board readiness: MIS took too long and changed every month (definitions not locked).
- Auditability: No trail to prove “where this number came from” within minutes.
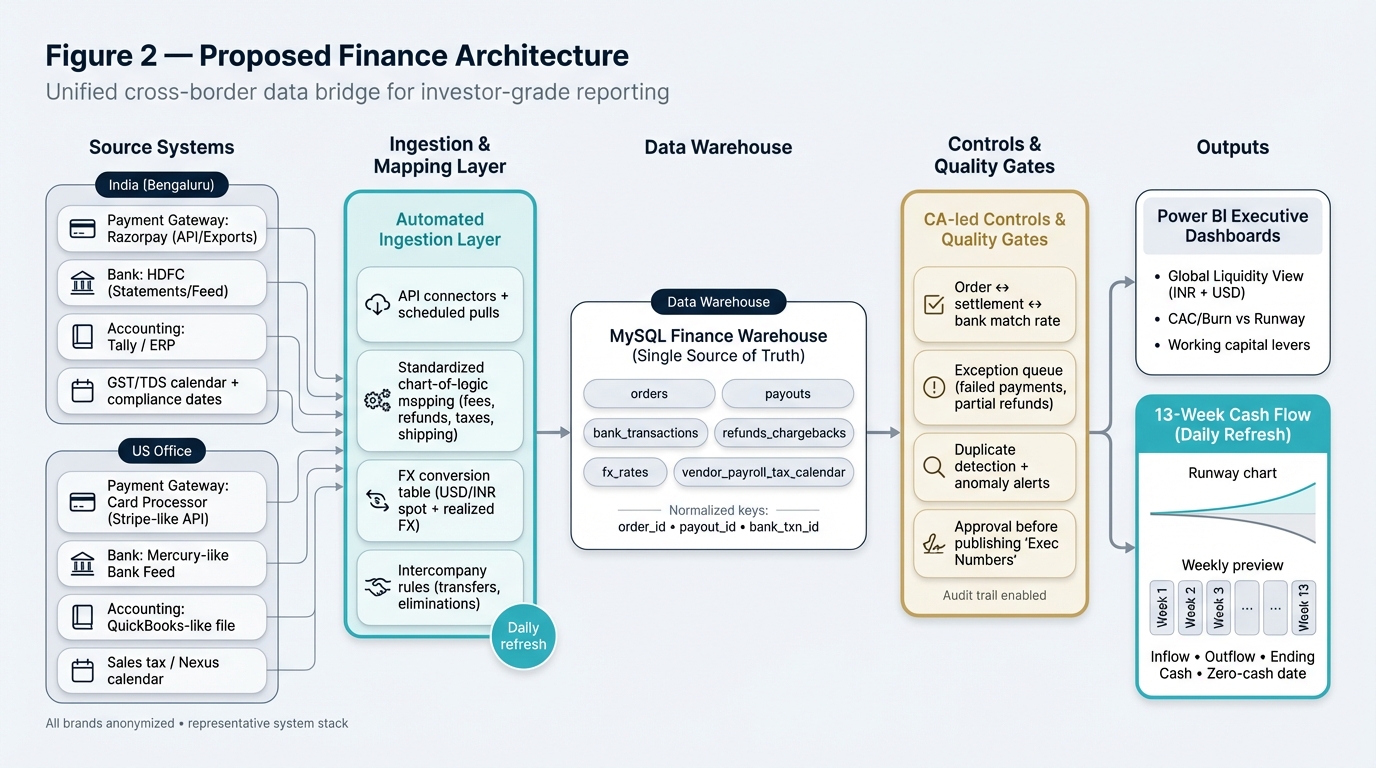
3) Target architecture: one unified finance stack across India + US
Design approvedWe proposed a unified “data bridge” architecture—treating the India and US entities as one financial system, while keeping accounting compliance intact per country. The output layer is executive-friendly and investor-grade.
Integration layer
- India: Razorpay settlement exports / API feeds + HDFC bank statement ingestion.
- US: Stripe payouts / balance transactions + Mercury bank feed ingestion.
- Rules: Standardized mapping for fees, refunds, chargebacks, shipping, taxes, discounts.
- Controls: Daily exception queue + reconciliation status tracking.
Data + BI foundation
- Warehouse: Central MySQL tables (orders, payouts, bank, FX, vendor dues).
- Modeling: Cash waterfall + forecast driver tables (AR timing, AP timing, payroll/tax calendar).
- BI: Power BI semantic layer for CFO/Founder views (RLS optional).
- Audit trail: Drill-down from dashboard → transaction list → bank line item.
Why this architecture works for fundraising
It creates a consistent definition of revenue, cash, and burn across entities—plus an audit trail. This is exactly what diligence teams expect when they ask: “Show me the underlying transactions.”
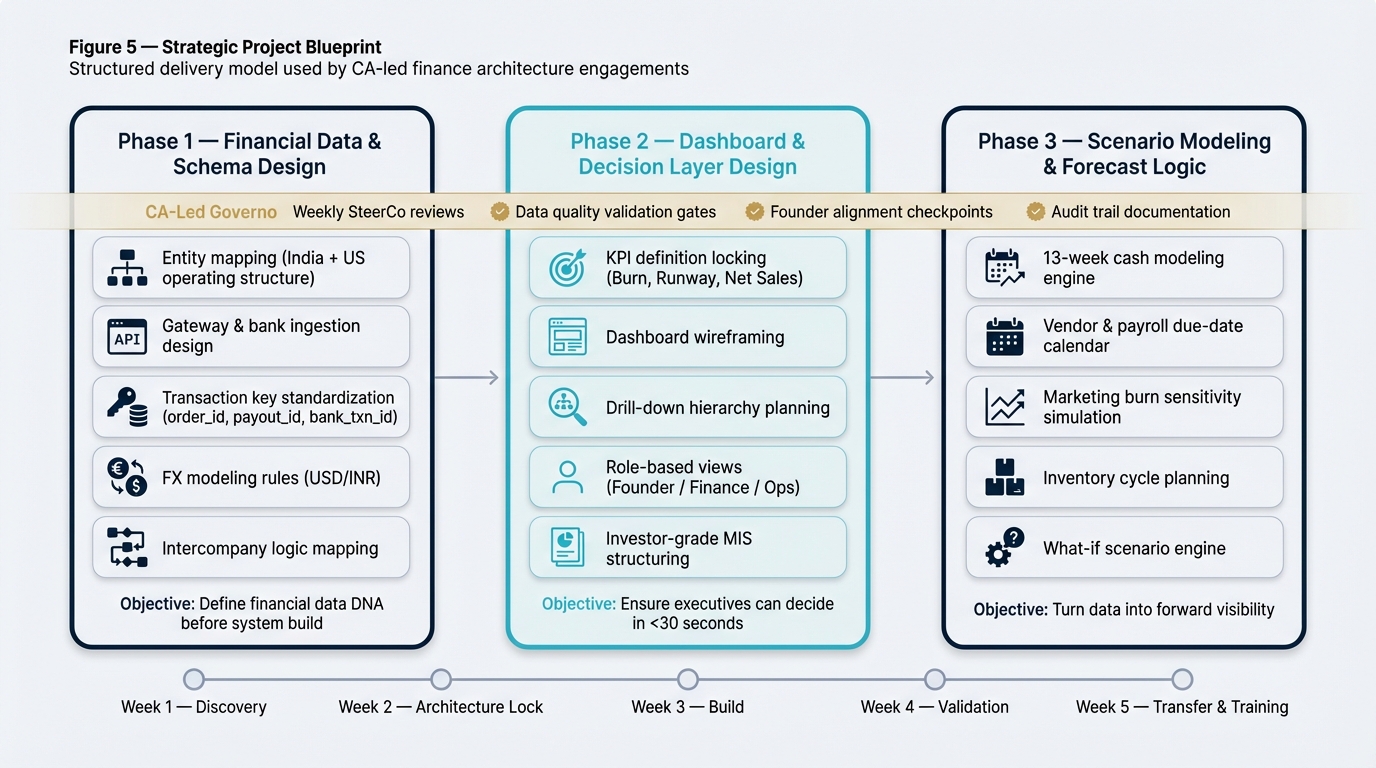
4) Build & controls: data design → BI design → quality gates → governance
Delivery methodThe project was run in a structured, CA-led delivery model. We did not jump into dashboards first. We locked definitions, built the data foundation, then BI, and finally SOP transfer to make it sustainable.
Phase A — Data design
- Entity and chart-of-accounts alignment across India + US.
- Common transaction keys: order_id, payout_id, bank_txn_id.
- FX logic: spot rate capture + realized/unrealized classification.
- Intercompany rules: inventory transfers + elimination logic.
Phase B — BI design
- Executive flow: “Runway → Week view → Driver → Transaction”.
- KPI definitions locked: net sales, contribution margin, burn, runway.
- Board-ready layout: consistent month cutoffs + weekly cadence.
- Role views: Founder, Finance Lead, Ops/Procurement.
Phase C — Quality gates & controls
- Daily reconciliation checklist (orders ↔ payouts ↔ bank).
- Exception queue for: failed payments, partial refunds, chargebacks.
- Variance alarms: sudden fee spikes, settlement delays, FX slippage.
- Approval workflow before publishing “Exec numbers”.
Governance cadence
- Weekly SteerCo with founders (decisions + blockers).
- Weekly cash committee: AP prioritization + runway actions.
- Monthly MIS pack freeze within 48 hours of close.
- Quarterly audit readiness review (controls + evidence).
5) The output: daily-refresh 13-week cash flow (INR + USD) with decision levers
Executive dashboardThe 13-week cash flow became the “single page” the founders used weekly. It unified India + US liquidity, embedded known commitments (payroll, taxes, vendor dues), and converted uncertainty into actions.
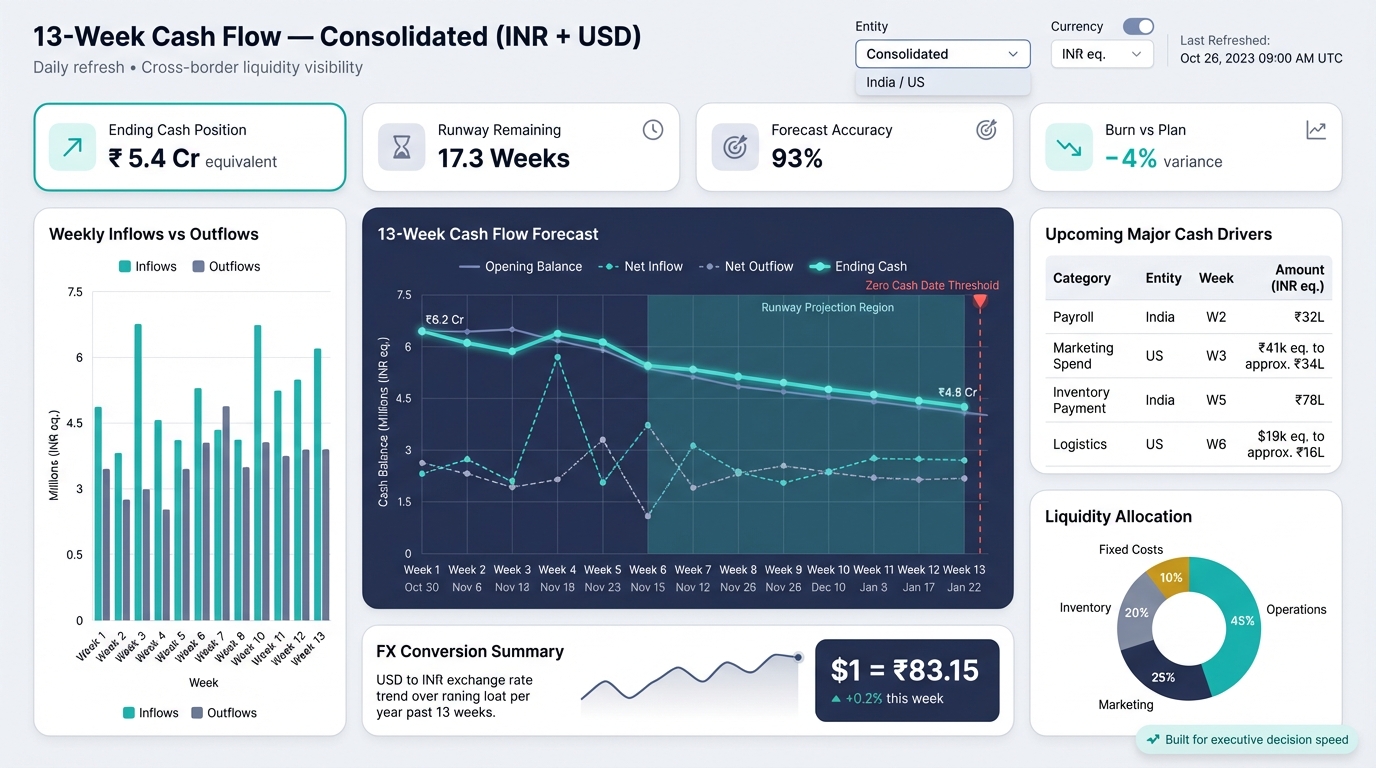
| Component | India (Bengaluru) | US Office | How it’s modeled |
|---|---|---|---|
| Inflows | Razorpay settlements, refunds netting, GST items | Stripe payouts, chargebacks, sales tax behavior | Settlement timing + fees + exceptions tracked |
| Critical outflows | Payroll INR, vendors, inventory buys, GST/TDS | Marketing spend USD, 3PL logistics, SaaS tools | Committed vs planned, due-date calendar driven |
| Currency | INR base | USD base | FX table + realized/unrealized reconciliation |
Note: Metrics shown are representative of a real engagement pattern; client name changed for confidentiality.
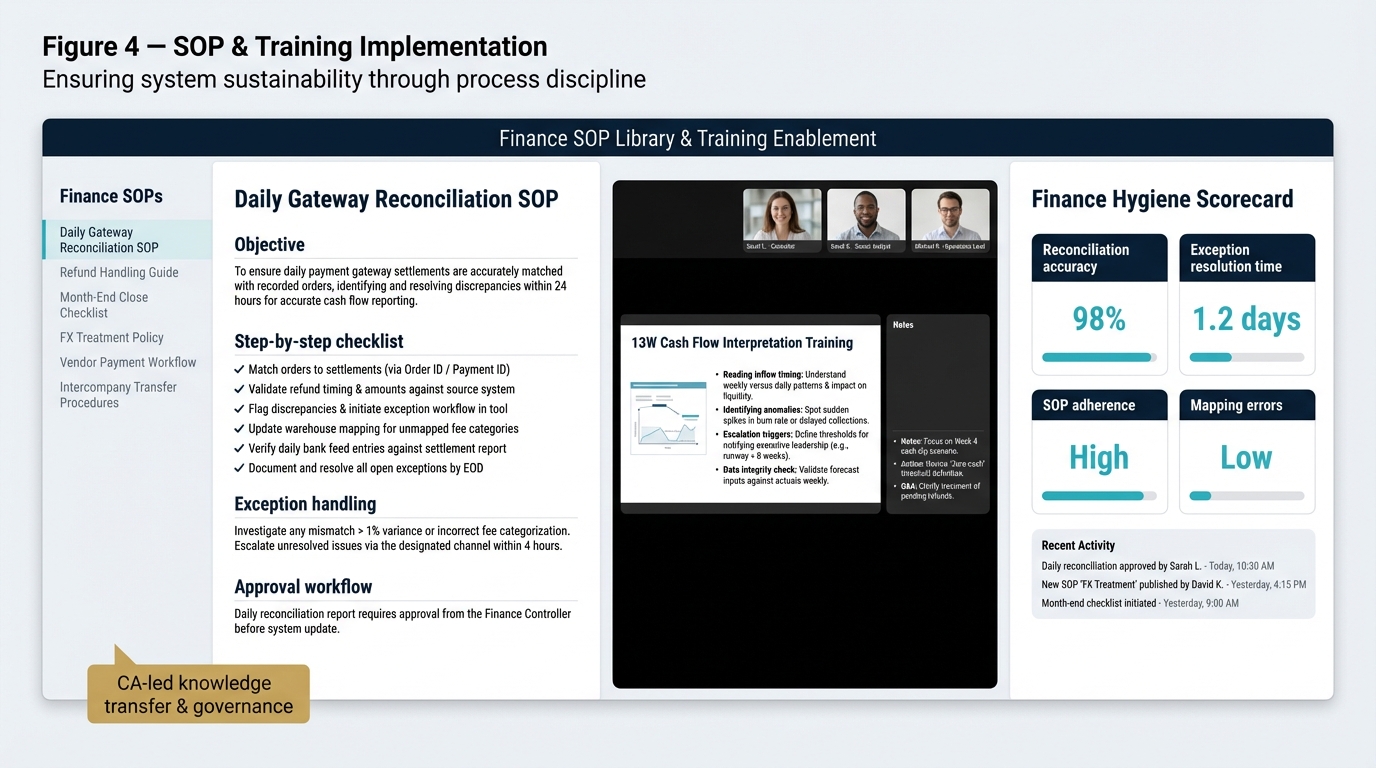
6) Sustainability: SOPs + employee training to stop anomalies permanently
Transfer packageA system only works if the internal team can operate it without heroics. We created SOPs, checklists, and role-based training so the “numbers stay clean” even during sale events and rapid growth.
SOP library (example modules)
- Daily reconciliation: orders ↔ settlements ↔ bank
- Refund/chargeback handling workflow (timing + approvals)
- Gateway fee mapping + accounting treatment
- Month-end close checklist + evidence folder structure
Training & enablement
- Hands-on sessions with Bengaluru finance team
- Cross-border mapping walkthrough for US ops
- Exception handling drills (real transaction samples)
- Monthly “data hygiene” scorecard + retraining
Control philosophy (simple)
We move clients from “spreadsheet outcomes” to controlled financial pipelines—where every key number has: definition → source → mapping rule → validation → owner.
7) Impact: before vs after
OutcomeThe engagement delivered a measurable shift: from reactive, delayed reporting to a predictable runway system that founders can trust—weekly, monthly, and during diligence.
| Area | Before VextaCFO | After VextaCFO |
|---|---|---|
| Cash visibility | Lagging, fragmented by entity and bank | Daily consolidated view with drill-down |
| Decision speed | Weekly “guesswork” meetings | Runway-first decisions within minutes |
| Errors/anomalies | Recurring due to inconsistent handling | SOP-driven operations + exception workflow |
| Board/investor readiness | MIS took ~7–10 days and kept changing | Stable MIS definitions, ready in <48 hours |
| Cross-border clarity | Two separate “truths” (India vs US) | Unified INR/USD view, aligned definitions |
8) Next steps: how VextaCFO runs this engagement for you
Engagement modelIf you operate across geographies (or multiple payment rails), cash can look healthy while the system is silently leaking. Our approach is structured, CA-led, and built for scale.
Week 1: Diagnostic & definitions
- Data inventory (gateways, banks, OMS, accounting)
- Definitions locked (sales, refunds, fees, burn, runway)
- Quick wins: leak points & control gaps
Weeks 2–4: Build + controls + dashboards
- Ingestion + mapping + warehouse tables
- Quality gates + exception workflows
- 13-week cash flow + MIS pack
Confidentiality
This case study is based on a real engagement pattern; the company name is changed. We never share client-identifiable data publicly.